Soil Temperature and Forest Type
R. F. MuellerJanuary 2002
Abstract
Soil temperatures are related to several forest types and different environmental conditions in the Central Appalachian Mountains. Of three forest types studied in most detail, a mountain White Pine- Hemlock- Hardwood forest with boreal components, in a valley flat at Ramsey's Draft in Virginia, had growing season soil temperatures lower than those of Oak- Hickory Ridge and Mesic Slope Forests in the Shenandoah Valley. Some early season temperature differences may be as great as 4 deg C. The Shenandoah Valley forest types exhibit considerable and complex seasonal variations in response to elevation, aspect and possibly soil moisture. Although the soil temperatures in all three forest types exhibit sharp seasonal variations, temperatures of a Deep-source Spring at Ramsey's Draft define a smooth curve with a maximum falling about a month later than the soil temperature maxima.
Soil temperatures were also determined at nine other locations in the mountains of Virginia and West Virginia and compared to the Ramsey's Draft data. As expected, low elevation, dominantly oak forest soil temperatures lie above the Ramsey's Draft trend, while those of valley flats with boreal floral components and those of high elevation forests lie near or below this trend.
The simplicity, reliability, low cost and, above all, the value of the data obtained from studies of this type speak for their standard incorporation into forest ecology field surveys. Additionally, their potential value for baseline studies of such phenomena as climate change may be significant.
Introduction
Experience tells us that temperature is a factor that enters into virtually all activities of our lives. In the natural world, the focus of interest here, it is a major element in the rates of chemical reactions, both inorganic and organic, and in the stability of systems ranging from mineral assemblages to biologic communities. In these systems it joins moisture and chemical composition as one of the most important determinants of what we observe.
Here emphasis is on soil temperatures, and to a lesser extent, on those of the natural waters that come in contact with soils. We are also interested in air temperatures, since these too affect species occurrence and stability, although they are not reported on here.. These several temperatures are closely related, but may be relatively independent of each other in the short-term. It is also possible that soil and air temperatures are to a degree additive in their biological effects, and this relation may explain some responses in floras that are larger than might be expected from soil temperatures alone.
It is axiomatic that temperature plays a critical role in the establishment and stability of a number of forest types, as long recognized in existing forests, in which some types bear a close relationship to latitude and elevation (Braun,1950), but also in the migration of these types during glacial and post-glacial times (Delcourt and Delcourt, 1981) .
In the Central Appalachians many forest types situated on various geologic substrates, at different elevations and topographic positions, are available for study. In our soil temperature survey concentration is on three forest types, which are situated at unlike elevations and topographic positions and on several geologic substrates. Surveyed less intensively are a number of additional types from mountain areas throughout the region.
All temperature measurements were made with a six-inch (15 cm) Reotemp probe ( Ben Meadows), which could be read to + or – 0.5 deg C. This thermometer was not compared to any other in any systematic way, but when checked was found to be in good agreement with other types. In every measurement an attempt was made to insert the probe to a depth of five inches (13 cm) into mineral soil beneath the leaf or needle mat. Holes for the probe were first punched with a stick or, in the case of hard or rocky soil, with a metal punch. However, in some cases much of the five- inch depth was through a thick organic mor layer. It was found that equilibration time of the thermometer with the soil frequently exceeded five minutes, so great care was needed to obtain good readings, particularly in dry soils.
The depth chosen for these measurements was based on ease of measurement and significance, since five inches generally lies within the zone of greatest feeder root development (Perry, 1982), but is still deep enough to avoid most short-term surface influences.
Virtually all measurements were made between 9:30 AM and noon, but a few were made in early afternoon. When tested, no evidence of change was detected throughout this interval. This result is consistent with the data of Cochran (1969), which shows only a few degrees difference between daily minimum and maximum soil temperatures at a depth of 13 cm beneath a mulch layer, a condition that resembles a leaf mat under a closed canopy, as in the present study. Also, the data of Davidson et al (1998) indicate that even at the shallow depth of 5 cm, forest soil temperatures may vary only a a degree over a span of several hours.
Ramsey's Draft
Our first area of concentration was Ramsey's Draft, Virginia, a small mountain stream valley, and in the vicinity of the Mountain House recreation site, immediately to the southwest of the Ramsey's Draft Wilderness of the George Washington National Forest (see our section on this area) . Seven soil temperature and four water temperature stations were established on the valley flat (flood plain) .Elevations ranged between 2200 and 2300 feet (671 and 702 m) asl. These stations were distributed over a distance of nearly a mile (1.6 km) from a little southeast of the Mountain House picnic ground to just within the Wilderness Area to the northeast. The water temperature stations included one Deep-source Spring, a temporary seep, a branch stream and Ramsey's Draft itself. All soil temperature stations but one had flat aspects, This exception was located at the base of the bordering slope and had a southeast aspect. Of significance here is that the area occupied by the soil and water temperature stations is, with the exception of a nearby highway, part of a forest tract of many thousands of acres. The flood plain alluvium is comprised dominantly of coarse siliceous material derived from sandstones, siltstones, shales and mudstones. Soil pH generally falls in the acid range, but there is considerable variation, and some sites attain circum-neutral values.. The forest type on the valley flat is White Pine- Hemlock-Hardwood. White Pine (Pinus strobus), Canada Hemlock (Tsuga canadensis), Tuliptree (Liriodendron tulipifera), Northern Red Oak (Quercus rubra) and Sycamore (Platanus occidentalis ) are among the largest trees, but Sugar Maple (Acer saccharum) is perhaps the most abundant, particularly as seedlings. Other common species are Black and Yellow Birches ( Betula lenta and B. alleghaniensis), Shagbark Hickory (Carya ovata), White Ash (Fraxinus americana), American Beech (Fagus grandifolia), Black Gum (Nyssa sylvatica), American and White Basswoods (Tilia americana an T. heterophylla), RedMaple( Acer rubrum), White Oak( Quercus alba), Black Locust (Robinia pseudoacacia) and Black Cherry (Prunus serotina) . Sassafras (Sassafras albidum), Chestnut Oak (Quercus prinus) and pignut hickory (Carya glabra and/or C. ovalis) are less frequently seen. Part of this forest is old growth primary forest, but old trees, some three feet (0.9 m) dbh or more, are quite common generally.
Understory trees noted are Striped Maple (Acer pensylvanicum), Muscletree (Carpinus caroliniana) and serviceberry (Amelanchier sp) . One seedling of Mountain Ash ( Sorbus americana) was seen. Shrubs include both mesic species such as Spice Bush (Lindera benzoin) and ericacaea like Mountain Laurel (Kalmia latifolia) . These woody plants are accompanied by a wealth of herbs, a number of which, such as Canada Mayflower (Maianthemum canadense) and Star Flower (Trientalis borealis) are, like Mountain Ash, boreal in character, attesting to cold air accumulation on the valley flat. Such accumulation here is particularly effective, owing to adjacent high mountains and the valley's configuration, which includes abutment on a steep mountain slope at a sharp bend . For details the reader is again referred to our section on the area.
Table 1 lists median values of soil temperatures, soil temperature spreads and single value water temperatures for the Deep -source Spring and Ramsey's Draft Stream. Other water temperatures are not included. Figure 1 shows plots of the median soil temperatures and single value temperatures for the Deep-source Spring. In this figure the soil temperature points have been joined by straight lines in recognition that the precise locations of these points are likely to be significant. We shall see that it is unlikely that any smooth function could approximate data of this type, since sharp fluctuations are inherent in them from a variety of factors, including particularly the weather.
| Date | Temperatures oC | Temperature Spreads oC | |
| 4-22-01 | soil | 10.0 | 9.0-12.5 |
| 4-22-01 | spring | 8.0 | |
| 4-22-01 | stream | 10.0 | |
| 6-4-01 | soil | 12.0 | 12.0-13.0 |
| 6-4-01 | spring | 12.0 | |
| 6-4-01 | stream | 13.0 | |
| 6-22-01 | soil | 17.0 | 16.5-17.5 |
| 6-22-01 | spring | 13.5 | |
| 6-22-01 | stream | 18.5 | |
| 7-28-01 | soil | 17.0 | 17.0-17.5 |
| 7-28-01 | spring | 15.0 | |
| 7-28-01 | stream | 17.5 | |
| 8-15-01 | soil | 18.0 | 17.5-19.0 |
| 8-15-01 | spring | 16.5 | |
| 8-15-01 | stream | 17.0 | |
| 9-11-01 | soil | 17.5 | 17.0-18.0 |
| 9-11-01 | spring | 17.0 | |
| 9-11-01 | stream | 17.5 | |
| 10-11-01 | soil | 12.0 | 11.5-13.0 |
| 10-11-01 | spring | 13.5 | |
| 10-11-01 | stream | 12.5 | |
| 11-2-01 | soil | 12.0 | 11.0-13.0 |
| 11-2-01 | spring | 13.0 | |
| 11-2-01 | stream | 12.0 | |
Table 1. Median temperatures and temperature spreads for seven soil temperature stations and single value water temperatures representing a Deep-source Spring and the Stream at Ramsey's Draft.
Note however that the Deep-source Spring data may be closely approximated by a smooth "breaking wave" curve. This form results from the characteristic that the Deep-source Spring temperatures are probably less subject to weather factors than those of the soil, and peak almost a month later. This delayed response is also shown by their higher values than those of the soil in October, after falling below the latter all summer. While the October flattening of the temperature trends is more difficult to explain, it may be a temporary response to leaf-fall and accumulation, which could serve to insulate the soil.
Stream water temperatures of Ramsey's Draft are similar to those of the soils, which may indicate a shallow source for most of this water.
Because the Ramsey's Draft soil temperatures represent an extensive area of valley flat, are associated with a quite uniform forest type and show little spread, they serve as an informative standard for comparison with similar data from other forest types and areas. They are thus employed in what follows.
Oak-Hickory Ridge Forest
Our second intensively studied area is an Oak-Hickory Ridge Forest ( "Mueller's Mountain") . This Ridge is adjacent to a rare calcareous wetland in the Central Shenandoah Valley of Virginia and is underlain by dolomitic limestone with large inclusions of the siliceous rock chert. The wetland, which is formed by an artesian spring, is located in a trap for cold subsiding air and, as a consequence, has a number of disjunct boreal plants that includes Buckbean (Menyanthes trifoliata) and Pussy Willow (Salix discolor) (Hunsucker and Mueller, 1998 ). The cold air in the vicinity of the wetland also influences the time of leafing-out of trees in the adjacent Oak-Hickory Ridge Forest, so those growing on the lower Ridge are retarded compared to those on the Ridge crest. Also, leafing-out on the Ridge as a whole is retarded relative to trees on nearby higher ridges, including the Mesic Slope Forest, which is part of our soil temperature study as well (see photos) .
Another important factor is the topographically exposed character and small size of the Ridge Forest, since it is elevated relative to its immediate, rather open surroundings, and occupies only about 30 acres (12 ha) . Thus weather conditions and thermal influences might be expected to change more rapidly than in larger forest tracts.
Although limestone is the dominant bedrock, the summit of the Ridge is formed largely of chert. Thus soils range from quite acidic to alkaline. Dominant canopy species on the Ridge, which rises 150 feet (46 m) above the wetland, are Black Oak (Quercus velutina), White Oak and several species of hickories. The forest on the southeast slope also has a mesic component that includes Black Walnut (Juglans nigra), Slippery Elm (Ulmus rubra), White Ash, Hackberry (Celtis occidentalis) and a few other species. The forest is generally young but mature, and has been subject to selective cutting about 30 years ago. Few trees exceed one foot (0.3 m) dbh. For details of the flora of the Ridge Forest see our section on Hydrastis canadensis L.
Median soil temperatures and the spread of these values are listed for the five stations in Table 2. These stations, which lie between 1590 feet (480 m) and 1700 feet (519 m) asl, include one on the northwest slope, one on the Ridge crest with an almost flat but NE aspect, two on the southeast slope and one at the edge of the wetland. Because the wetland site is open, it yielded the highest temperatures, while those from the northwest slope were generally the lowest. The relatively large spreads in the temperatures are in large part attributable to the inclusion of the temperatures from the wetland edge.
The median soil temperature values from Table 2 have been plotted on Figure 2, which also shows the soil temperature trend from Ramsey's Draft for comparison. Although the Oak-Hickory Ridge data show rather abrupt changes in soil temperatures, they clearly lie substantially above those of Ramsey's Draft. This difference is particularly marked during the early growing season when vegetative growth is most rapid. When all of our data have been presented it will be of interest to discuss other features of this graph.
| Date | Temperatures oC | Temperature Spreads oC |
| 4-7-01 | 12.0 | 9.0-12.0 |
| 4-21-01 | 12.0 | 10.0-12.0 |
| 4-29-01 | 13.0 | 11.0-16.0 |
| 5-8-01 | 14.5 | 12.5-16.5 |
| 5-22-01 | 16.5 | 14.0-17.5 |
| 5-30-01 | 15.5 | 14.0-17.5 |
| 6-11-01 | 17.0 | 16.0-19.0 |
| 6-29-01 | 20.0 | 19.0-21.0 |
| 7-15-01 | 18.0 | 17.0-19.5 |
| 8-1-01 | 19.0 | 18.0-20.0 |
| 8-12-01 | 21.5 | 21.0-22.5 |
| 9-6-01 | 18.5 | 18.0-20.5 |
| 9-30-01 | 13.5 | 13.5-15.5 |
| 10-13-01 | 15.0 | 14.5-16.0 |
| 10-30-01 | 11.0 | 10.0-12.0 |
Table 2. Median temperatures and temperature spreads for five soil temperature stations in the Oak-Hickory Ridge Forest.
Mesic Slope Forest
Our third subject of intensive study is the Mesic Slope Forest on the ridge ( "Pileated Peak") across the Folly Mills Valley from the Oak-Hickory Ridge. Here seven soil temperature stations were distributed along a traverse line perhaps ˝ mile (0.8 km) in length between 1650 and 1880 feet (503 and 573 m) asl. Aspect was northwest at one station, north at four and near flat at two on the ridge top. The latter stations consistently yielded the highest temperatures. Although this forest is also underlain by calcareous bedrock, soils and sub-soils are deeper and rock exposures far fewer than on the Oak- Hickory Ridge. Soils are dominantly moderately acidic (pH in the vicinity of 5.0 –5.5), but are more strongly acidic on the ridge top. The slope soils are of the rich mull type and high in organic matter.
The canopy at all stations but one is young / mature, with tree diameters ranging up to two feet (0.6 m) or more and of uneven age. The exception occurs at the lowest elevation in a stand of Pitch Pine (Pinus rigida) saplings. The mature canopy, which is part of a substantial tract of forest several hundred acres in extent, is dominated by Northern Red Oak, Tuliptree, Red Maple, Black Walnut, White Ash, White Oak, Bitternut Hickory (Carya cordiformis), White and Americam Basswoods and Black Cherry. Minor Beech and Sugar Maple occur as saplings. Chestnut Oak and Black Gum increase toward the ridge top, where White Pine also occurs. The most common understory tree is Hophornbeam (Ostrya virginiana), there is a little Muscletree, and Spice Bush is an abundant shrub on part of the ridge top as well as on the slope.
There is a luxuriant complement of herbs that includes species such as Black Cohosh (Cimicifuga racemosa), Pale Jewelweed (Impatiens pallida) and Horsebalm (Collinsonia canadensis), among many others. No markedly boreal species were seen.
Median values obtained from the seven soil temperature stations as well as the spread in values are shown in Table 3, and the former have been plotted in Figure 3, which also shows the Ramsey's Draft trend.
| Date | Temperatures oC | Temperature Spreads oC |
| 4-8-01 | 10.0 | 9.0-10.0 |
| 4-24-01 | 13.5 | 13.0-14.0 |
| 5-5-01 | 15.0 | 14.5-16.0 |
| 5-23-01 | 13.5 | 13.0-14.0 |
| 6-8-01 | 16.0 | 16.0-17.0 |
| 6-27-01 | 17.5 | 17.5-19.0 |
| 7-14-01 | 17.5 | 16.5-18.0 |
| 7-25-01 | 19.5 | 19.5-20.5 |
| 8-8-01 | 20.0 | 19.5-21.5 |
| 8-26-01 | 19.0 | 18.0-21.0 |
| 9-18-01 | 16.0 | 15.5-18.5 |
| 10-4-01 | 15.0 | 14.0-16.5 |
| 10-23-01 | 13.5 | 12.5-15.5 |
Table 3. Median temperatures and temperature spreads for seven soil temperature stations in the Mesic Slope Forest.
A feature of this plot is the rapid rise in soil temperatures in the Mesic Slope Forest during April and early May relative to those in the Oak-Hickory Ridge Forest during the same period. Since most of the temperature stations in the Mesic Slope Forest lie at higher elevations, they probably were subject to higher air temperatures, particularly before leaves emerged, a consequence of which may have been the precipitous drop in temperature immediately thereafter.. Another feature of Figure 3 is the relatively modest fluctuation in soil temperatures after leaf emergence, compared to that of the Oak-Hickory Ridge Forest. This may be a consequence of the moderating effect of the northerly aspect, the dominance of soils richer in organic matter, and the more extensive tract of enclosing forest, relative to that of the Oak-Hickory Ridge.
Additional Soil Temperatures from the Mountains
Table 4 and Figure 4 exhibit data from nine Central Appalachian locations in Virginia and West Virginia, although not this many distinct forest types. All data represent single value measurements. As in the other figures, the Ramsey's Draft soil temperature trend is shown for comparison. Not all the values in Table 4 have been plotted in Figure 4.
Maple Flats is a unique area of nutrient deficient soils, and the soil temperature data from there all represent upland oak forests. Mill Hill and Morris Hill are sites with several forest types related to topography and underlying rock types., while the one value from Blowing Springs represents a flood plain in this complex area. In contrast
| Dates | Locations | Elevations(Meters) | Aspects | Soil Temperatures °C |
| 4-27-01 | Maple Flats (MF) | 488 | flat | 12.0 |
| 4-27-01 | Maple Flats (MF) | 488 | flat | 11.0 |
| 4-27-01 | Maple Flats (MF) | 476 | flat | 12.0 |
| 4-27-01 | Maple Flats (MF) | 470 | NE | 12.5 |
| 4-27-01 | Maple Flats (MF) | 468 | flat | 12.5 |
| 4-27-01 | Maple Flats (MF) | 488 | flat | 13.0 |
| 5-14-01 | Mill Hill (MH) | 512 | W | 11.0 |
| 5-14-01 | Mill Hill (MH) | 550 | flat | 13.5 |
| 5-14-01 | Mill Hill (MH) | 560 | flat | 12.5 |
| 5-15-01 | Blowing Springs (BS) | 525 | flat | 13.0 |
| 6-14-01 | Morris Hill (MoH) | 730 | flat | 16.5 |
| 6-14-01 | Morris Hill (MoH) | 550 | SE | 17.5 |
| 6-14-01 | Morris Hill (MoH) | 540 | SE | 18.5 |
| 7-10-01 | Cathedral St. Park (CP) | ~770 | flat | 17.0 |
| 7-10-01 | Cathedral St. Park (CP) | ~770 | flat | 16.0 |
| 7-10-01 | Cathedral St. Park (CP) | ~770 | flat | 16.0 |
| 7-11-01 | Cathedral St. Park (CP) | ~770 | flat | 17.0 |
| 7-20-01 | Tea Creek (TC) | 950 | flat | 16.0 |
| 7-20-01 | Tea Creek (TC) | 950 | flat | 17.0 |
| 7-20-01 | Tea Creek (TC) | 950 | W | 16.0 |
| 7-21-01 | Tea Creek (TC) | ~1000 | NE | 16.0 |
| 8-20-01 | Reddish Knob (RK) | 1296 | NW | 16.0 |
| 8-20-01 | Reddish Knob (RK) | 1160 | SW | 17.0 |
| 8-20-01 | Reddish Knob (RK) | 1160 | SE | 17.0 |
| 8-21-01 | Reddish Knob (RK) | 1340 | W | 15.5 |
| 8-21-01 | Reddish Knob (RK) | 1160 | N | 15.5 |
| 8-21-01 | Sugar Grove (SG) | 610 | NW | 16.5 |
| 8-29-01 | North River Valley (NR) | 720 | flat | 19.0 |
| 8-29-01 | North River Valley (NR) | 720 | E | 18.5 |
| 9-12-01 | North River Valley (NR) | 700 | flat | 17.5 |
| 9-13-01 | North River Valley (NR) | 647 | flat | 17.0 |
| 9-26-01 | North River Valley (NR) | 647 | flat | 14.0 |
Table 4. Single value soil temperatures from nine locations in the Central Appalachians.
to these largely low elevation oak forests of Virginia, the Tea Creek forest occupies a somewhat higher and cooler valley flat and the adjacent lower slope on West Virginia's Allegheny Plateau. This forest is decidedly mesic and contains numerous boreal and montane species including Red Spruce (Picea rubens) . Much the same is true of Cathedral State Park, also in West Virginia, which, however, is old growth Hemlock- Hardwood forest on highly acidic substrate.
The Reddish Knob area, on the Virginia – West Virginia boundary, which is dominated by Northern Red Oak, reaches the highest elevations of our study. The single value from near Sugar Grove, West Virginia, represents forest at the base of the steep scarp of Shenandoah Mountain and is probably a product of cooling by subsiding air.
Although the North River Valley forests of Virginia are at similar elevations and have many of the same floral characteristics as those of Ramsey's Draft, they occupy a much broader valley that opens to the south without interruption. Consequently the capacity of this valley to pond cold subsiding air from the highlands is considerably less than at Ramsey's Draft. The result is a scantier boreal flora.
For a more complete picture of these areas the reader is referred to our list of inventories.
As a whole, the positions of the temperature data points in relation to the Ramsey's Draft trend, as shown in Figure 4, are in essential agreement with the elevations and topographic positions of the forest types represented. Those from the low elevation, mostly oak forests on the left of the figure generally lie well above the Ramsey's Draft distribution line, while the high elevation Reddish Knob and cold valley flat Tea Creek and Cathedral Park data mostly lie well below. The North River data also fit the pattern, lying close to the line for the most part, in keeping with the similarity of the forest type represented to that at Ramsey's Draft.
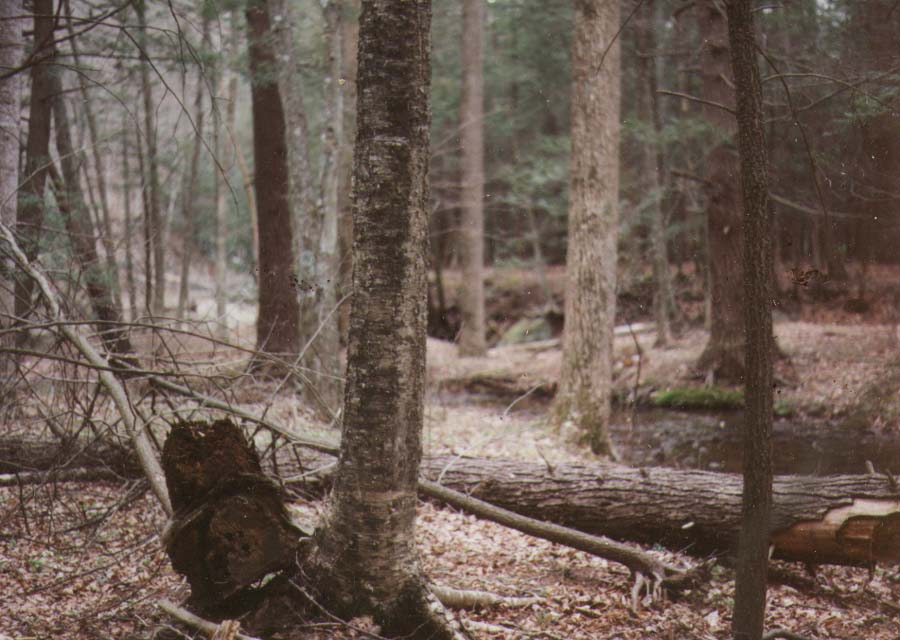
Soil temperature station 1
4-22-01 Ramsey's Draft (Click to enlarge)
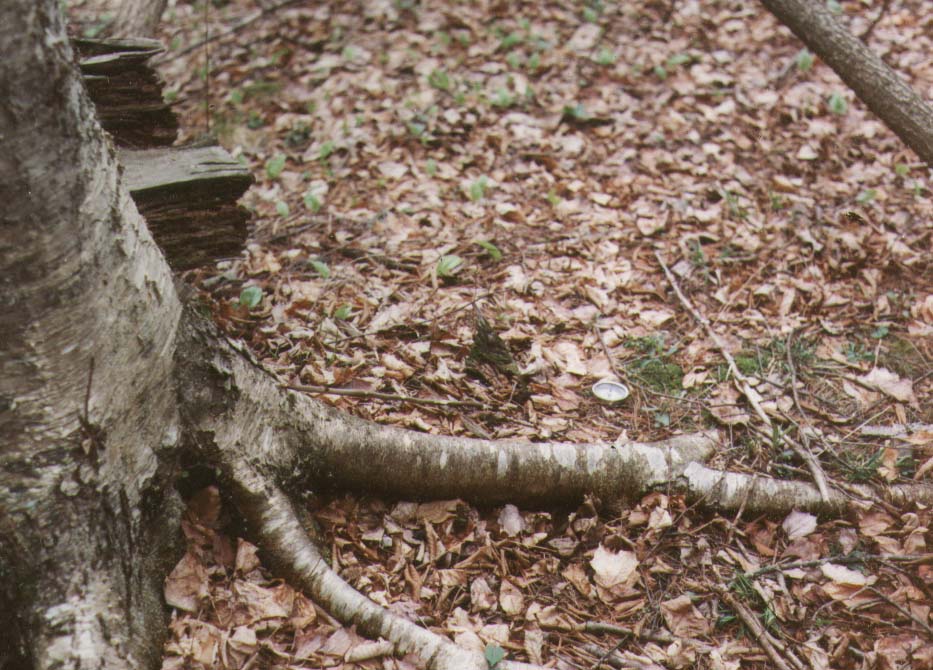
Soil temperature station 1
4-22-01
Ramsey's Draft. Note Probe. (Click to enlarge)
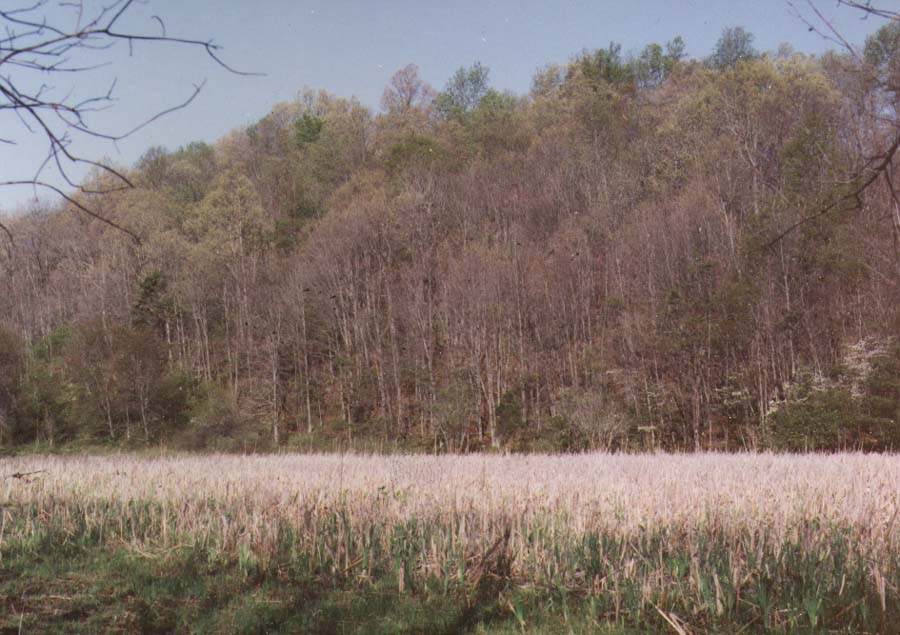
Oak and Hickory Ridge Forest, 4-30-01
Note leafing-out gradient (Click to enlarge)
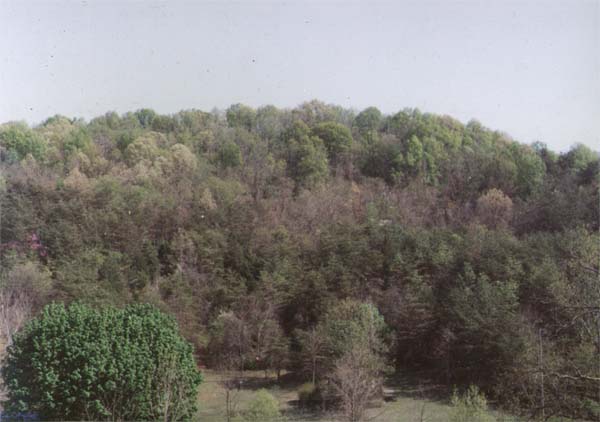
Mesic Slope Forest
4-30-01. Note leafing-out gradient.
Disregard Acer platanoides in foreground. (Click to enlarge)
|
|
Summary
Soil and water temperatures are subject to a variety of environmental influences. Most prevalent are the effects of latitude, elevation and continentality Superimposed are those of topography, aspect, forest type and forest extent and continuity. Important manifestations of forest type are light intensity and character, and the character of the leaf mat and forest floor. Products of all these influences are soil type and biologic activity. Feedback or mutual influence is important in a number of these factors as well. Although some influences on the soil and water temperature distributions have already been discussed, others may be deduced from the figures.
The general rise in soil and water temperatures during the early part of the growing season is a feature of the first three figures. This is a period of intense biologic activity, when leaf emergence and vegetative growth are greatest. Minor set-backs of soil temperatures during this period, as that in Figure 2 are more difficult to explain, but may be related to more intense shade following full canopy leaf cover, but at a later date than that in the Mesic Slope Forest as shown in Figure 3.
The late season convergence of the temperatures as shown in Figures 1,2 and 3 is also of interest. The Shenandoah Valley sites are located only 20 miles (32 km) from Ramsey's Draft. Thus it is likely that the region – wide relatively high temperatures of late summer overwhelm the largely topographically- induced microclimates that prevail earlier in the season.
The three major energy-related processes in forests are photosynthesis, respiration and evapotranspiration. While photosynthesis is "endoergic", respiration and evapotranspiration are likely to be exothermic and endothermic respectively. in overall influences, including those on the soil. Davidson et al (1998) found that soil respiration decreases markedly during drought periods. Of interest therefore are the periods of precipitous soil temperature decline in early July and during August, both exceptionally dry periods, while the intervening period was one of some shower activity. It may be that these soil temperature declines were a consequence of interrupted exothermic respiration of plant roots and soil flora and fauna, while the endothermic activity associated with evapotranpiration of necessity continued. Although no supporting data are presented here, preliminary observations hint that there may also be a correlation between early season soil temperatures and the character of the soils, with the lowest temperatures associated with acid, mor types, presumably due to lower biologic activity in them.
It should also be noted that while the variation in summer soil temperatures is greater in the Oak-Hickory Ridge Forest data of Figure 2, corresponding features also occur during the same periods in Figures 1 and 3 for Ramsey's Draft and the Mesic Slope Forest. Because of the large gap in the Ramsey's Draft data from mid-June to late July, it is not possible to say what occurred during this period. However, the apparent leveling-off may well correspond to the decline in the temperatures of Figure 2. The same may be said of the data from the Mesic Slope Forest for the same period in Figure 3. As previously indicated, such features may be related to soil moisture variations. Also consistent with a coordinated response in the three areas, considering the paucity of data, is the near coincidence of the yearly soil temperature maxima in all three figures. The steep decline in soil temperatures in the Oak-Hickory Ridge Forest and the more modest responses in the other forests may be a consequence in part to the prominence of southeast aspects and more exposed position of the former.
Although our effort here is concentrated on soil temperatures, the data from the Deep-source Spring at Ramsey's Draft is of particular interest. Although these data are few in number, their disposition is so orderly that informative conclusions may be drawn from them. Because the first six points all fall on or close to (within the measurement uncertainty) a smooth, simple curve, it is tempting to conclude that the waters they represent originated at depths beyond superficial weather or other soil temperature influences. This conclusion is supported by the position of the curve's maximum, which occurs about a month later than the maxima of soil temperatures. Furthermore, the reversal of soil and water temperatures in October, with the Deep-source Spring water temperature becoming higher than soil temperature, is consistent with the foregoing properties.
Our experience here seems to indicate that soil temperature studies of this type may have a potential as an additional dimension of forest ecology. Their yield of information is large, given their simplicity, reliability, low expense and ease of execution. Beyond their utility in forest ecology, there is also a potential as indicators of secular changes, particularly in relation to climate. Data of the type presented here may serve as baselines if short- term perturbations are not too great and the secular changes can be distinguished from this background. Primary to such an effort are well-located multi-station sites that show minimal temperature variation between stations. A forest being monitored for its soil temperatures should have reached maturity, be secure from changes in forest type and not be subject to outside influences such as deforestation of adjacent areas, particularly in the same watershed and airshed. Considered in these terms and as illustrations, Ramsey's Draft and the Mesic Slope Forest should be superior to the Oak-Hickory Ridge Forest as potential sites for baseline studies.
Acknowledgements
The author greatly appreciates the steadfast assistance of Patagonia Corporation and our fiscal sponsor, Save America's Forests, who have done so much to further this Project. He is also thankful for the pleasant companionship in the field and many stimulating and informative conversations with Robert Hunsucker and Dorothy Simkins.
Also appreciated is the patient assistance with the computer given by his wife, Elizabeth DeMar Mueller and webmaster son, Gus Mueller.
References
Braun, E. Lucy (1950) Deciduous Forests of Eastern North America. Macmillan, New York.
Cochran, P. H. (1969) Thermal properties and surface temperatures of seedbeds – a guide for foresters. USDA Forest Service Pacific Northwest Forest Range Expt. Station. Portland, Oregon.
Davidson, Eric A., Elizabeth Belk and Richard D. Boone ( 1998) Soil water content and temperature as independent or confounded factors controlling soil respiration in a temperate mixed hardwood forest. Global Change Biology 4, 217-228.
Delcourt, Paul A. and Hazel R. Delcourt (1981) Vegetation Maps for Eastern North America: 40,000 B. P. to the Present.in Geobotany II. Robert C. Romans, editor. pp 123-165. Plenum Press, New York.
Hunsucker, Robert and R. F. Mueller (1998) Folly Mills Calcareous Wetland, Augusta County, Virginia.Forests of the Central Appalachians Project. Virginians for Wilderness web site.
Perry, Thomas O. (1982) The Ecology of Tree Roots and the Practical Significance Thereof. Journal of Arboriculture. 8 (8),197-211.